With the recent sell off in the US markets and the Sahm Rule Recession indicator triggering (signals a recession very likely once US unemployment rate 3-month average rises by 0.5% from 12 month low), it’s a great time for a macro analysis of Australia.1 I will analyse data from the RBA and ABS to try to explain monetary changes since July 2023 (my last macro review). Please note some graphs may look different due to the seasonally adjusted data.
Chart 1 illustrates the increase of Monetary Base (defined as currency in circulation plus deposits of banks with the RBA) and the recent sharp decrease. The monetary base year-on-year change has been negative since May 2023. This means the RBA has been reducing the amount of cash in the banking system. This sharp decline is most likely contributed to the RBA’s term funding facility which started in 2020, where the RBA gave $188 billion to financial institutions to boost credit access and help keep interest rates low. The banks had to repay this funding facility by June 2024. See image below “RBA Assets”.
Chart 2 illustrates the increased lending from banks between March 2021 to October 2022, and the subsequent reduction in lending as the M1 (currency plus bank current deposits of the private non-bank sector) year-on-year change decreased, turning negative last year. Interestingly, M1 year-on-year change has been recently increasing, and now you can see ADI reported credit is turning upwards. An increase in M1 isn’t going to help inflation (see chart 3 below)!
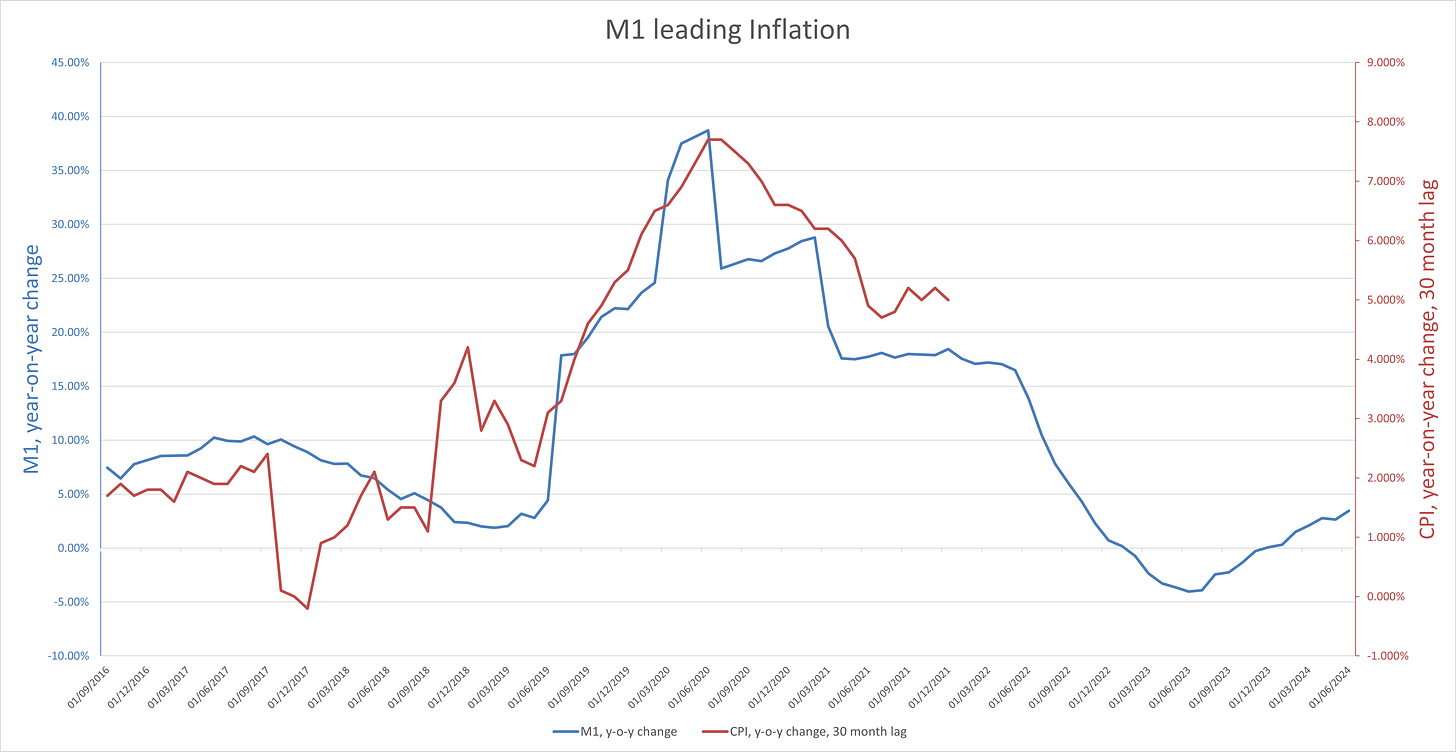
Chart 3 illustrates the leading effect M1 has on CPI. Despite limited data, CPI seems to lag M1 year-on-year change by 24 to 30 months. If the trend stays true, CPI may stay constant until Jan 2025 where it will start to decrease, reaching the 1-2% range in Jan 2026.
Chart 4 compares the CPI to the RBA Cash rate target. Usually, central banks do not cut rates until the cash rate is above CPI, so if the trend in Chart 3 stays true, the RBA may not cut rates until Jan 2025. This aligns with markets now expecting a cut in February 2025.2
Chart 5 shows the Australian 10 Years / Australian 2 Years Government Bond Spread, which inverted in June 2023. Since then, it has remained positive. This spread turning positive, from a negative, may indicate a recession in 12-24 months. I guess we now just wait, and see?
This chart from the RBA interestingly illustrates the reduction in household savings in conjunction with the decrease in disposable income and reduced consumption. Usually when savings is decreased, consumption is increased and vice versa. I assume the reduction in all 3 can be contributed to the high interest rates and increased mortgage repayments.
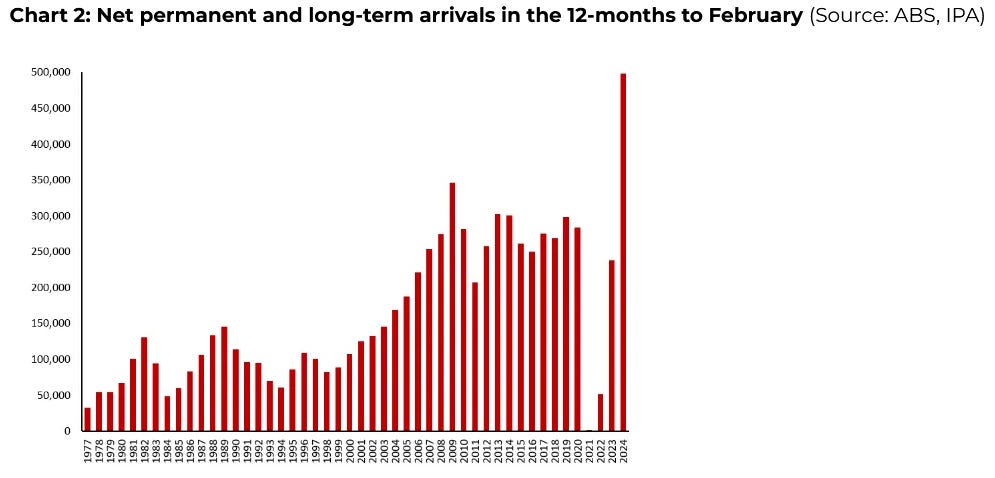
This table highlights the 4 quarters of negative GDP per capita, and the first time since 1983 that this has occurred. This means at an individual level, Australia is in a recession. The increase in immigration wouldn’t have helped. From Feb 2034 to Feb 2024, net permanent and long time arrivals totalled nearly 500,000 and the highest number on record. See image below, net arrivals in the 12 months to February.
In conclusion, I believe Australia is in a Stagflation predicament, as illustrated by negative GDP per capita and persistent inflation. With the rest of the world dropping rates (ECB & Canada) or just about to drop rates (USA), I believe Australia didn't raise rates above CPI quick enough, resulting in persistent inflation. If a major economic event occurs and the RBA is forced to cut rates, inflation will really wreck those without hard assets such as Bitcoin, gold or real estate.
https://x.com/Schuldensuehner/status/1819364625214804272
https://www.afr.com/policy/economy/these-interest-rate-hawks-have-now-changed-their-minds-20240801-p5jyak


