
Inflation in Australia, are we there yet?
Inflation in Australia, are we there yet?

The Reserve Bank of Australia’s (RBA) response to the COVID-19 pandemic was quantitative easing (QE), or ‘money printer go brrr’, on an astronomical scale. This paper will analyse the year-on-year Monetary Base Compound Annual Growth Rate (CAGR) for the Australian dollar. As well as detailing how RBA performs QE and comparing this response to the global financial crisis. This analysis will hopefully determine where Australia is regarding the current and future state of inflation.
The astronomical QE actions taken by the RBA is clearly illustrated in the year-on-year CAGR for the AUD monetary base. See Figure 1 (RBA 2022a).
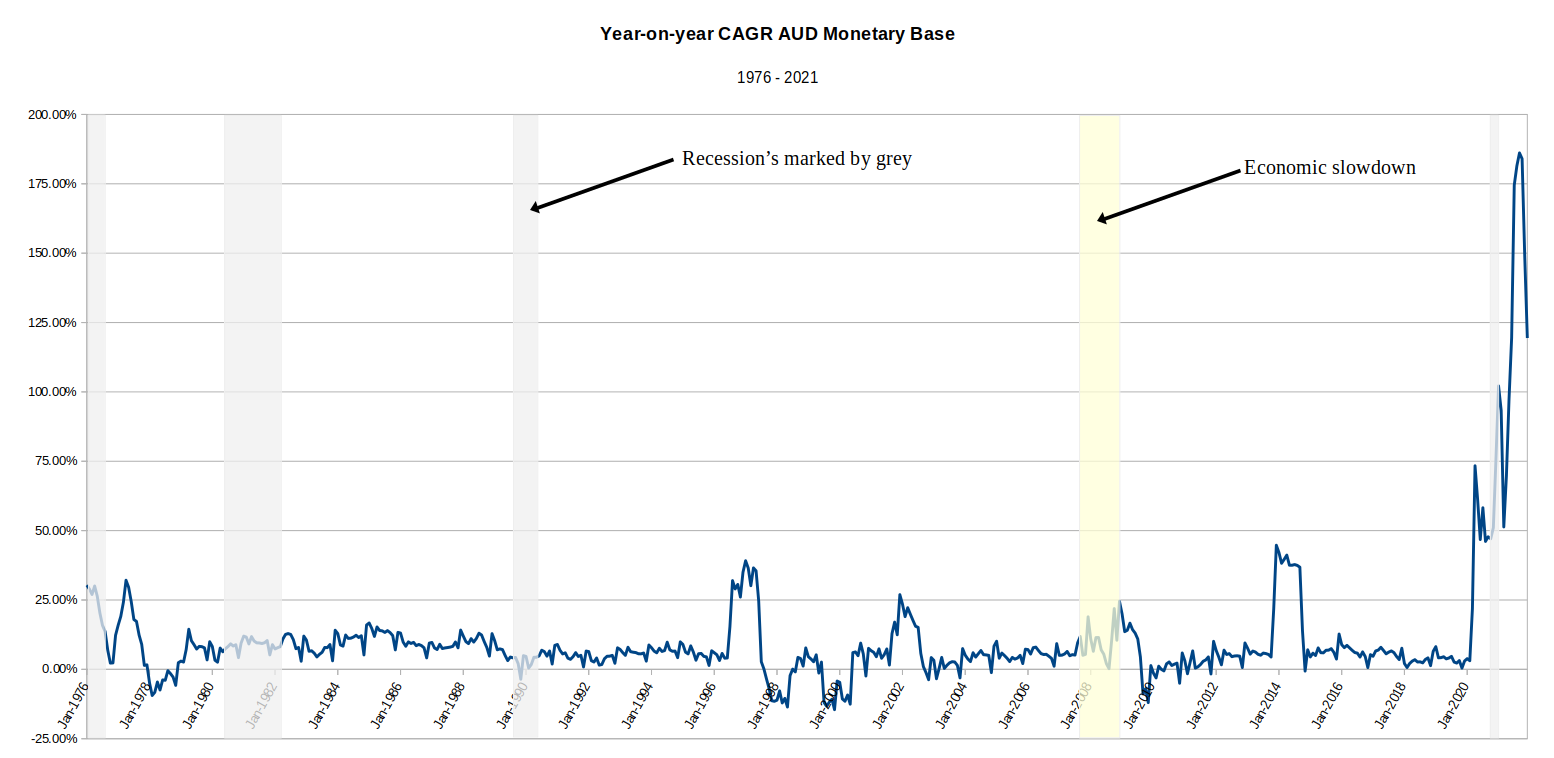
This chart peaks at a year-on-year increase of 186% in September 2021, approximately four times higher than the previous high in 2014.
One may raise the question, why isn’t Australia experiencing a hyperinflation scenario with the increase in money base then? To answer, all this money printing has already produced inflation, as seen in the government skewed December 2021 CPI recorded at 3.5% (potentially higher in real life). The following analysis will hopefully demonstrate why Australia is not currently experiencing hyperinflation, as well as explain how inflation could increase if banks loosen their reserve requirements.
The RBA, and other central banks, control the monetary base by open market operations. Increasing the money base by purchasing bonds from authorised deposit-taking institutions (ADIs) (or banks), and reducing the money base by selling bonds to ADIs. This occurs daily between the RBA and ADIs, however, the amount increases when undertaking QE.
Due to fractional reserve banking, ADIs can leverage their capital by leading out excess funds over the capital reserve requirement, yielding higher profits for the bank. The required reserve ratio is set according to the Australian Prudential Regulation Authority(APRA) and the Basel III accord. These reserves ensure banks have enough liquidity to cover outflows during a crisis. The QE process of the RBA buying bonds from ADIs, and these ADIs lending out excess reserves can be easily explained through an example.
Firstly, the RBA buys $100 million of bonds from Bank A where the reserve ratio is 10%. Bank A can lend out $90 million, and in doing so increases its reserves by $10 million. The borrower of the $90 million spends the money, and is deposited at Bank B. Bank B can now lend out $81 million, keeping $9 million as reserves. This $81 million is now spent and deposited at Bank C, where the bank keeps $8.1 million as reserves and lends $72.9 million. This process continues to have a multiplier effect on the original $100 million. (Mishkin, 2014)
The formula for the multiplier effect is -

where -


For the above example, the original $100 million is multiplied t $1,000 million due to the fractional reserve banking system.

In this example, the RBA increased the monetary base by $100 million, which eventually causes M1 to rise by $1,000 million.
This example shows the powerful effect of QE. Once the RBA purchases the bonds, the control the RBA has over the multiplier effect is reduced. This process can take 6 to 12 months to be seen in the market and GDP, meaning the RBA could potentially over or under shoot its target. This monetary policy can be compared to fiscal policy which is performed by the government. Fiscal policy could include helicopter money as seen in 2009 when Kevin Rudd’s stimulus package paid each person $300 to $950 depending on income. This form of stimulus promptly enters the financial system, with results quickly noticeable in GDP.
So why didn’t the 186% year-on-year CAGR of monetary base increase lead to higher inflation? Because the ADIs did not lend out all of their excess reverses. The ADIs kept the majority of the reserves deposited at the RBA in Exchange Settlement Accounts. These are classed as high-quality liquid assets, reducing stress on the banks and propping up their balance sheets maintaining and/or increasing the profitability of the bank. Due to the high amount of leverage in the financial system and the potential for bad loans resulting from the pandemic, banks wanted to ensure they could cover any loss.
As seen in figure 2, from January 2019 to December 2021 Monetary base increased by 353%, whilst M1 only increased by 85% (RBA 2022a). This increase will result in inflation but not to the possible potential of the multiplier effect (if banks were to lend out all of their excess reserves).

M1 should be monitored as well as the total credit in the system, figure 3 illustrates the close relationship between year-on-year change in M1 and ADI reported credit (RBA 2022a, RBA 2022b). Between January 2009 and December 2021, the average difference between the two values has been 7%, currently the difference is at 9% with credit rising sharply. Credit in the financial system may continue to increase in the near future, and the effect on M1 should be closely monitored. The multiplier effect would suggest M1 would also slightly increase with the increase in credit.

Increasing credit in the financial system is a good example of the Cantillion Effect. During crises, banks are more likely to lend to high-quality borrowers. These high-quality borrowers can access cheap credit and buy up cheap assets. As this lending and borrowing of money flows through the system, the money supply increases (multiplier effect), causing inflation and resulting in more expensive assets for the people at the lower end of the income spectrum.
During the 2008-09 global financial crisis (GFC), the monetary base increased by 46% between January 2006 and December 2011 resulting in an M1 increase of 64%, as seen in figure 4 (RBA 2022a). Comparing the GFC response to the recent response from the RBA, see figure 2, M1 is currently rising less than the money base, meaning there are greater reserves held by the banks and less lending.

Figure 4 illustrates very low friction between the RBA’s open market purchase of bonds and the ADIs lending out excess reserves. The RBA’s QE response to the GFC was nowhere near the response of COVID-19, as seen in figure 1 the year-on-year CAGR of the money base only peaked at 25% in 2009.
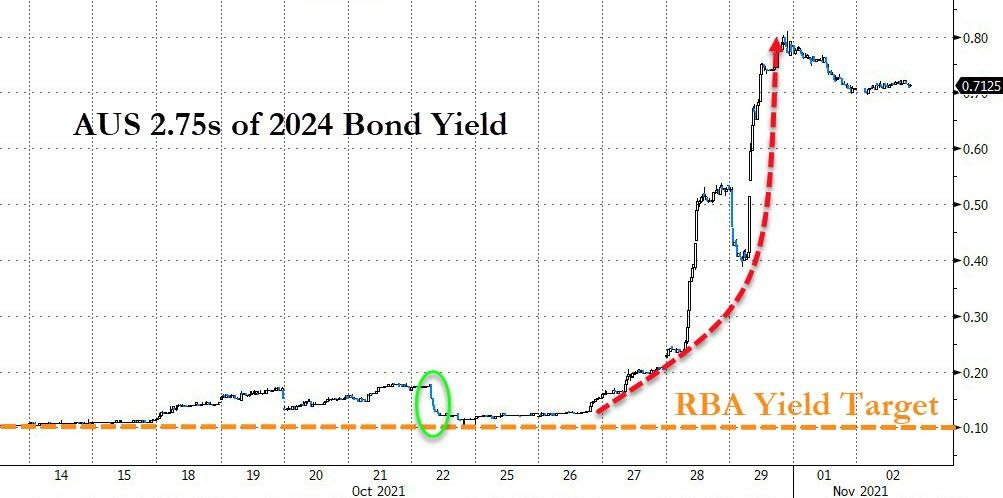
In response to COVID-19, the RBA bought over $300 billion in government bonds, targeting yield curve control. They planned was to keep the 2 and 3-year bond yields at 0.10%, which meant buying these dated bonds; essentially manipulating the market pricing of these bonds. In November 2021, this manipulation became too costly for the RBA and the market quickly repriced the bonds yields to 0.71% once the RBA stopped buying those bonds. The market was pricing in potential inflation and a recovering economy. Figure 5 highlights the quick repricing of the 2024 bond yield once the RBA stopped its open market purchases (Durden, 2022).
Despite the RBA’s astronomical bond purchasing program resulting in a year-on-year monetary base CAGR peaking at 186%, inflation has not been as severe as it could potentially be. This is due to the ADIs holding more reserves and not leveraging all of their capital, resulting in M1 increasing less than the monetary base since the start of the COVID-19 pandemic. Year-on-year M1 change and the change in ADI reported credit should be closely monitored in the short term to determine if bank reserves are reducing, as this may indicate and lead to higher inflation. A haven from the potential higher inflation in Australia, where an increase in M1 would further depreciate the AUD against the USD, would be scarce assets such as bitcoin, gold and real estate. Comparing the three assets, Bitcoin is a real free market asset and is not manipulated by central banks like the gold market. Bitcoin has a lower market entry price and no ongoing costs when compared to real estate.
RBA, 2022a. Statistical Tables, Monetary Aggregates – D3. Available at: <https://www.rba.gov.au/statistics/tables/> [Accessed 21 February 2022].
RBA, 2022b. Statistical Tables, Growth in Selected Financial Aggregates – D1. Available at: <https://www.rba.gov.au/statistics/tables/> [Accessed 21 February 2022].
Durden, T., 2022. RBA Abandons Yield Target Due To 'Economic Improvement' | ZeroHedge. Available at: <https://www.zerohedge.com/markets/rba-abandons-yield-target-due-economic-improvement> [Accessed 21 February 2022].
Mishkin, F., 2014. Economics of money, banking & financial markets. Harlow: Pearson Education Limited, pp.462-465.